
Appearance
Graph & inspector
The graph gives you a map of the model you captured. Start with its modules, expand the parts you want to understand, and keep the rest in context.
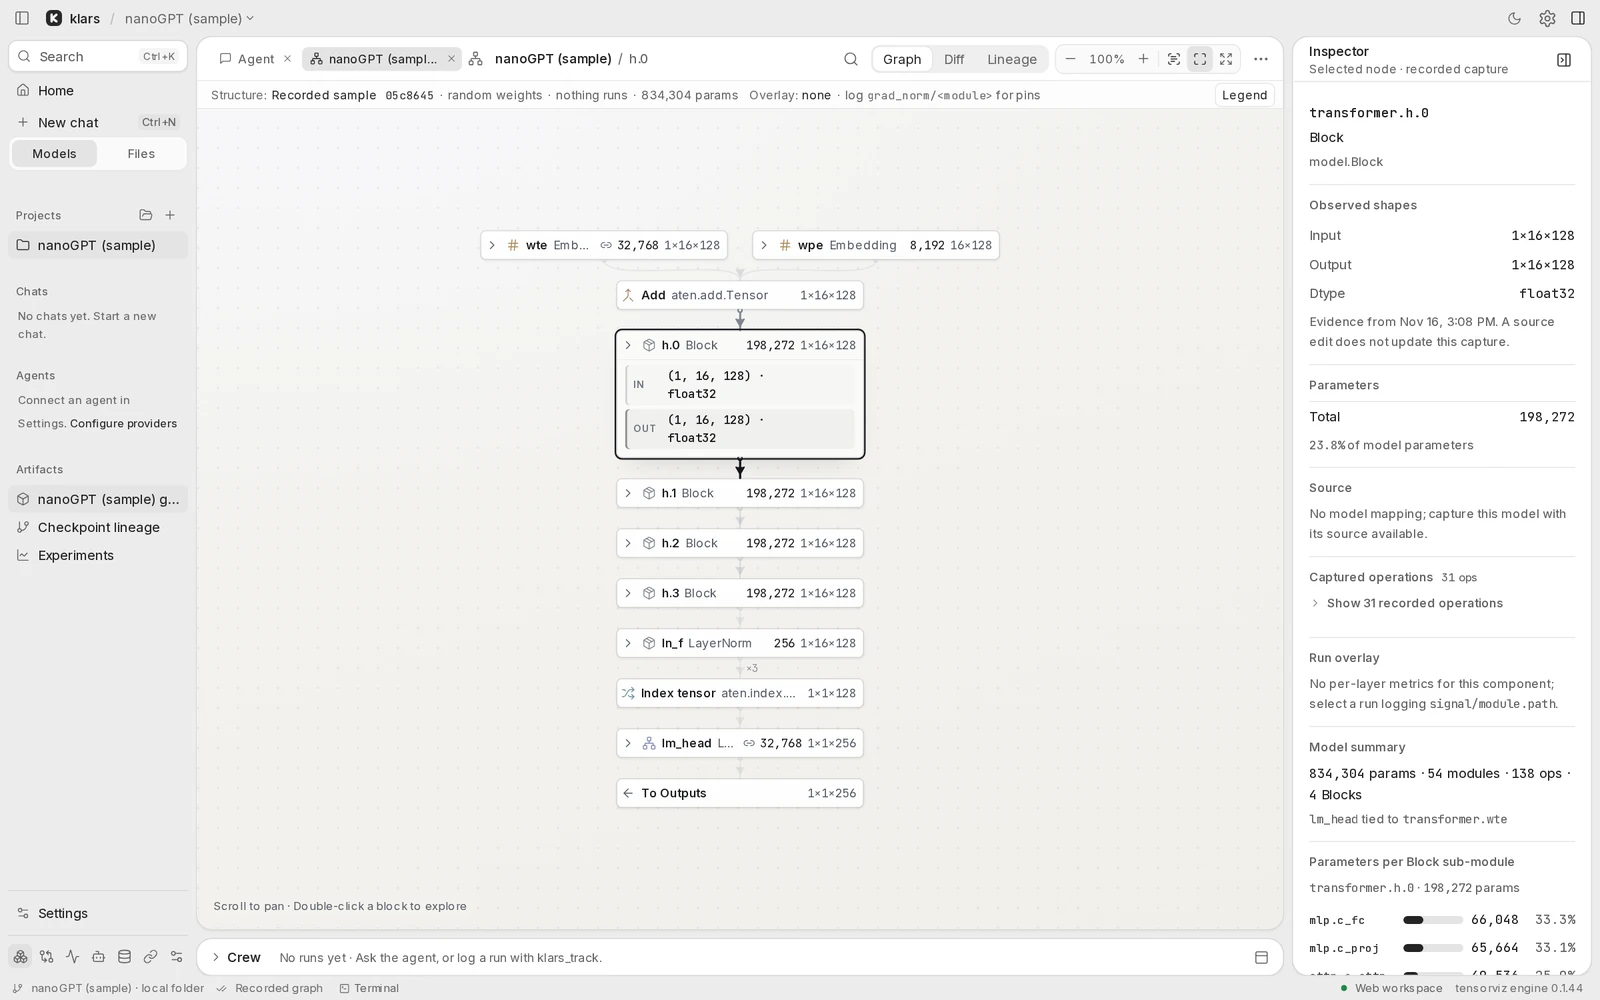
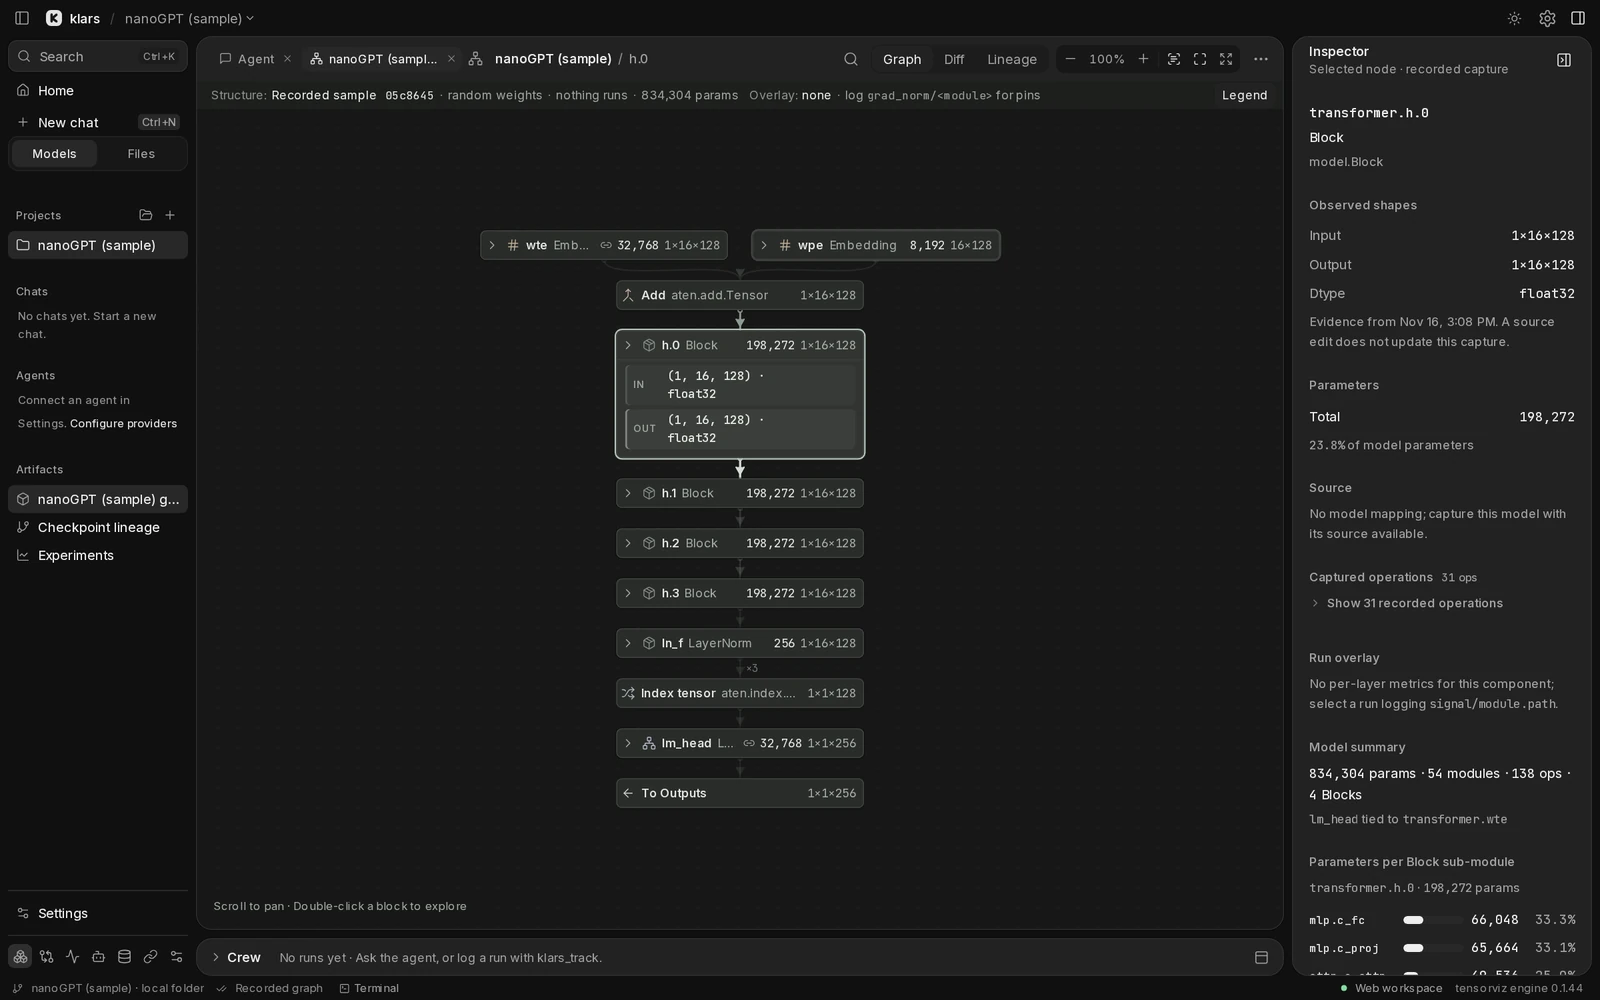
Navigate the architecture
Scroll to pan. Double-click a block to explore it, and use the scope breadcrumbs to return to its parent. The zoom controls offer Fit all and Readable views.
Repeated blocks can be grouped, low-level trace operations can be folded, and shared weights have tied-weight annotations. Where the graph offers Show trace ops or Expand repeats, use them to reveal that detail.
Use the graph’s search control to find a layer by name. Press / when focus is in the graph to open Find a layer.
Inspect a selection
Select a module to open the inspector. It follows the current selection and shows the information available for that capture: tensor contract, shapes, parameters, and source links.
Ask about in the inspector brings that component into the conversation. The inspector’s model summary also shows parameter counts and per-Block parameter meters when the capture contains them.
If nothing is selected, the inspector can close automatically. Open it yourself to see guidance, or select another component to fill it.
Open source when you need it
Choose Open source in the inspector, use Graph actions ⋯, or press ⌘ / Ctrl Shift S to toggle the source pane.
The workspace offers Model, Split, and Code layouts. On a narrow window, source replaces the graph; use ‹ Graph to return. This source view is for reading and review. Agent changes follow the proposal flow.
Read the evidence
The provenance strip tells you which model structure or capture you are viewing. A shapes-only graph cannot tell you activation values. A recorded graph does not update merely because a source file changed; create a new capture when you need new evidence.
Overlay run metrics
Per-layer metrics use keys in the form <signal>/<module path>, for example grad_norm/transformer.h.0.attn.
When a selected run contains matching metrics, numbered pins connect graph modules to Hotspots in the inspector. If no per-layer metrics were logged, the inspector says so. klars does not collect those measurements automatically.
Continue with workspace views or comparing captures.